资讯专栏INFORMATION COLUMN

本文主要是详细介绍了pyecharts制作时长滚动图片柱状图+饼状图+玫瑰图+折线统计图,文章内容把握重点把握重点详尽的基本介绍,具有很强的实用价值,感兴趣的朋友可以了解一下。
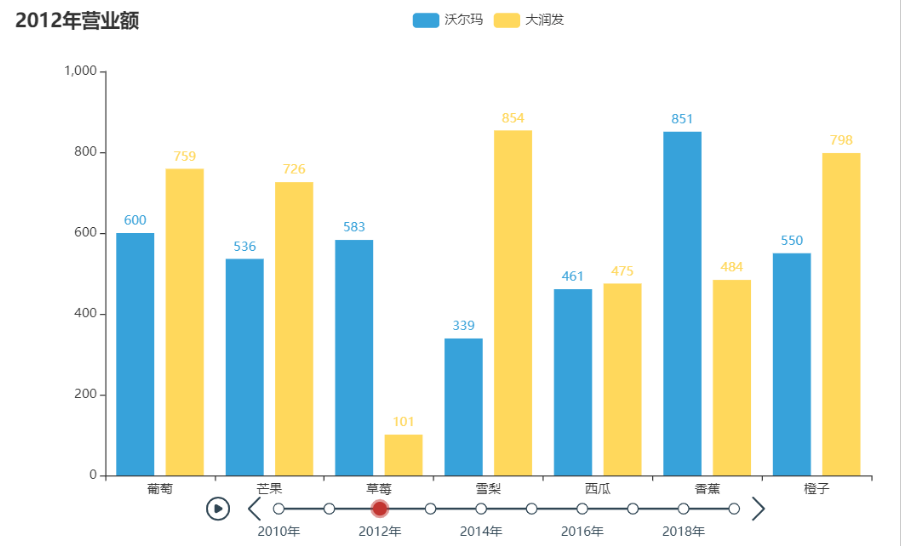
1、pyecharts绘制时间轮播柱形图
  from random import randint
  from pyecharts import options as opts
  from pyecharts.charts import Bar,Timeline
  from pyecharts.globals import ThemeType
  data={'x':['葡萄','芒果','草莓','雪梨','西瓜','香蕉','橙子'],
  '沃尔玛':dict(zip(range(2010,2020),[[randint(100,1000)for fruit in range(7)]for year in range(10)])),
  '大润发':dict(zip(range(2010,2020),[[randint(100,1000)for fruit in range(7)]for year in range(10)]))
  }
  def timeline_bar()->Timeline:
  x=data['x']
  tl=Timeline(init_opts=opts.InitOpts(theme=ThemeType.LIGHT))
  for i in range(2010,2020):
  bar=(
  Bar(init_opts=opts.InitOpts(theme=ThemeType.LIGHT))
  .add_xaxis(x)
  .add_yaxis('沃尔玛',data['沃尔玛']<i>)
  .add_yaxis('大润发',data['大润发']<i>)
  .set_global_opts(title_opts=opts.TitleOpts("{}年营业额".format(i)))
  )
  tl.add(bar,"{}年".format(i))
  return tl
  timeline_bar().render("timeline_bar.html")

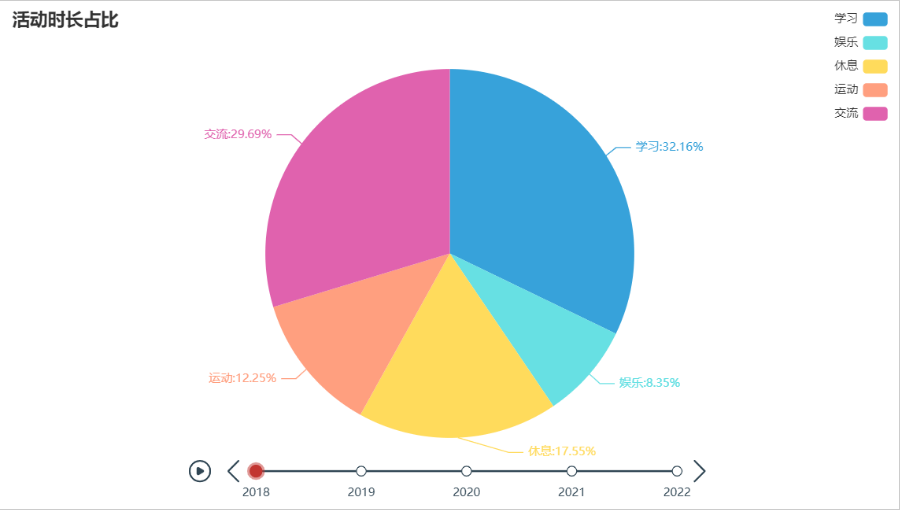
2、pyecharts绘制时间轮播饼图
  #导入模块
  from random import randint
  from pyecharts import options as opts
  from pyecharts.charts import Pie,Timeline
  from pyecharts.globals import ThemeType
  attr=["学习","娱乐","休息","运动","交流"]
  list1=[2018,2019,2020,2021,2022]
  list2=[[randint(100,1000)for time in range(7)]for year in range(5)]#嵌套列表
  data={'x':attr,
  '时长':dict(zip(list1,list2))
  }
  def timeline_pie1()->Timeline:
  x=data['x']
  tl=Timeline(init_opts=opts.InitOpts(theme=ThemeType.LIGHT))
  for i in list1:
  c=(
  Pie(init_opts=opts.InitOpts(theme=ThemeType.WONDERLAND))#主题风格
  .add("",[list(z)for z in zip(attr,data['时长']<i>)])
  .set_global_opts(title_opts=opts.TitleOpts(title="活动时长占比",pos_top="top",pos_left="left"),
  legend_opts=opts.LegendOpts(pos_left="right",orient="vertical"))#设置标题
  .set_series_opts(label_opts=opts.LabelOpts(formatter='{b}:{d}%')))#显示百分比
  tl.add(c,"{}".format(i))
  return tl
  timeline_pie1().render("timeline_pie.html")
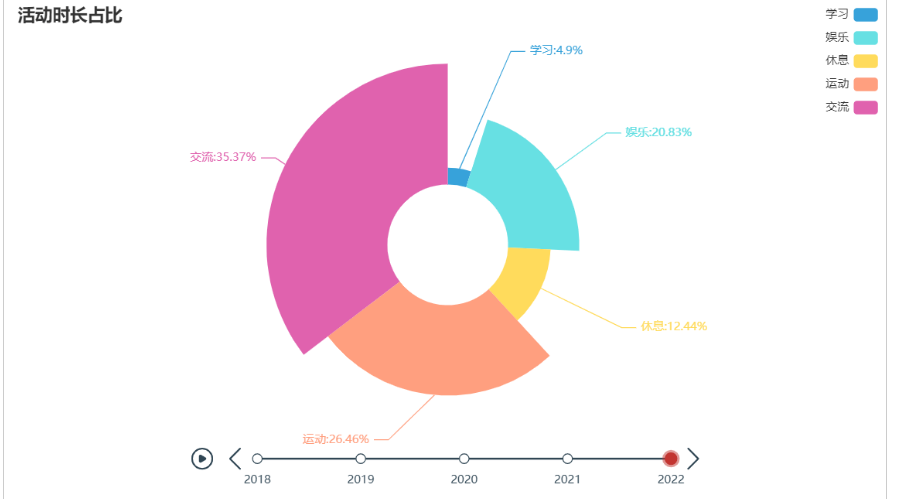
3、pyecharts绘制时间轮播玫瑰图
  #导入模块
  from random import randint
  from pyecharts import options as opts
  from pyecharts.charts import Pie,Timeline
  from pyecharts.globals import ThemeType
  attr=["学习","娱乐","休息","运动","交流"]
  list1=[2018,2019,2020,2021,2022]
  list2=[[randint(100,1000)for time in range(7)]for year in range(5)]#嵌套列表
  data={'x':attr,
  '时长':dict(zip(list1,list2))
  }
  def timeline_bar1()->Timeline:
  x=data['x']
  tl=Timeline(init_opts=opts.InitOpts(theme=ThemeType.LIGHT))
  for i in list1:
  c=(
  Pie(init_opts=opts.InitOpts(theme=ThemeType.LIGHT))#主题风格
  .add("",[list(z)for z in zip(attr,data['时长']<i>)],radius=["25%","75%"],rosetype="radius")
  .set_global_opts(title_opts=opts.TitleOpts(title="活动时长占比",pos_top="top",pos_left="left"),
  legend_opts=opts.LegendOpts(pos_left="right",orient="vertical"))#设置标题
  .set_series_opts(label_opts=opts.LabelOpts(formatter='{b}:{d}%')))#显示百分比
  tl.add(c,"{}".format(i))
  return tl
  timeline_bar1().render("玫瑰图.html")

4、pyecharts绘制时间轮播折线图
  #导入模块
  from random import randint
  from pyecharts import options as opts
  from pyecharts.charts import Line,Timeline
  from pyecharts.globals import ThemeType
  list1=[2018,2019,2020,2021,2022]
  list2=[[randint(100,1000)for time in range(7)]for year in range(5)]#嵌套列表
  data={'x':['学习','娱乐','休息','运动','交流'],
  '时长':dict(zip(list1,list2))
  }
  def timeline_bar()->Timeline:
  x=data['x']
  tl=Timeline()
  for i in list1:
  bar=(
  Line()
  .add_xaxis(x)
  .add_yaxis('时长(min)',data['时长']<i>)
  .set_global_opts(title_opts=opts.TitleOpts("{}年活动时长统计".format(i)))
  )
  tl.add(bar,"{}年".format(i))
  #tl.add_schema(play_interval=1200,#播放速度
  #is_timeline_show=False,#是否显示timeline组件
  #is_auto_play=True)
  return tl
  timeline_bar().render("折线图.html")
综上所述,这篇文章就给大家介绍到这里了,希望可以给大家带来帮助。
文章版权归作者所有,未经允许请勿转载,若此文章存在违规行为,您可以联系管理员删除。
转载请注明本文地址:https://www.ucloud.cn/yun/128741.html
小编写这篇文章的一个主要目的,继续为大家介绍关于Python相关事宜,介绍的内容主要是教我们如何去绘制饼状图,具体怎么去做呢?下面就给大家详细的解答下。 概念 饼图(pie chart)是用圆形及圆内扇形的角度来表示数值大小的图形,它主要用于表示一个样本(或总体)中各组成部分的数据占全部数据的比例。仅排列在工作表的一列或一行中的数据可以绘制到饼图中。饼图显示一个数据系列(数据系列:在图表中...
摘要:柱状图,饼状图,点状图等等您能想到的类型全部支持。这个开源库的官网直接看如何只用行代码就实现专业的统计图表。第八行声明要显示的统计图的类型。如果是线状图,柱状图这些类型,则定义的维度作为统计图的纵坐标也就是坐标。 提升程序员工作效率的工具/技巧推荐系列 推荐一个功能强大的文件搜索工具SearchMyFiles 介绍一个好用的免费流程图和UML绘制软件-Diagram Designer...
摘要:如图表控件对象。用来表示一组柱状图。饼状图注意,饼状图与其他图表不同的是,饼状图并没有轴,也不支持缩放。为了更好的显示效果,饼状图的布局宽高应相等。显示在内测,显示在外侧。默认值为,表示饼状图尽可能地占满整个控件。 HelloChart常见的API 一、主要的类 XXXValue:用来对单个的数据进行包装。如PointValue、SubcolumnValue;XXXChartData:...
阅读 1173·2023-01-14 11:38
阅读 1162·2023-01-14 11:04
阅读 992·2023-01-14 10:48
阅读 2546·2023-01-14 10:34
阅读 1249·2023-01-14 10:24
阅读 1132·2023-01-14 10:18
阅读 738·2023-01-14 10:09
阅读 824·2023-01-14 10:02